- Ample global spare capacity lowers risk of goods price inflation beyond tariffs as manufacturers trim inventories and purchasing
- North American manufacturers report steepest drop in material purchases since May, signaling weaker production ahead
- Chinese factories pull back buying, increasing spare capacity across Asia’s suppliers
- Europe’s manufacturing sector recovery continues to make slow progress
CLARK, N.J., Nov. 12, 2025 /PRNewswire/ — Manufacturers in North America reduced their purchases of raw materials and intermediate goods in October, according to the GEP Global Supply Chain Volatility Index, which based on a monthly survey of 27,000 businesses worldwide. The fall in input demand—a key early indicator of factory output—was the steepest since May and suggests that production in the region is set to cool in the coming months.

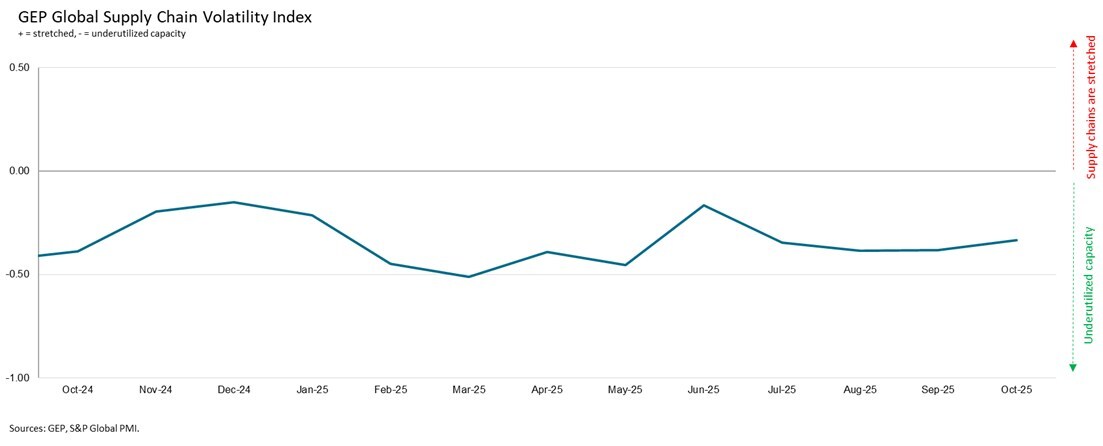
Interpreting the data: Index > 0, supply chain capacity is being stretched. The further above 0, the more stretched supply chains are. Index < 0, supply chain capacity is being underutilized. The further below 0, the more underutilized supply chains are.
The Volatility Index, which tracks demand conditions, shortages, transportation costs, inventories, and backlogs, registered –0.33 in October, indicating that global supply chain capacity remains underused. Manufacturers across major economies continued to keep inventories lean and curb new purchases of inputs.


In North America, the slowdown followed several months of tariff-driven stockpiling earlier in the year. Firms reported both lower material purchasing and a reduction in deliberate inventory building, taking pressure off supply chains which are now running well below full capacity.
Asia’s momentum also faded. A pullback in factory buying across China offset continued strength in India, leading to a broader softening across the region.
In Europe, manufacturers showed only a marginal increase in activity. Capacity at suppliers remains underutilized, and firms in Germany, France, Italy, and the U.K. continued to restrict raw material purchasing, underscoring a sluggish industrial recovery.
“North America is seeing the clearest sign yet of a manufacturing pullback,” said Michael DuVall, Vice President, Consulting, GEP. “Manufacturers are buying less and working down inventories, which points to weaker production through the winter. With space capacity across global supply we do not anticipate any price pressure, beyond tariffs, on buyers.”
OCTOBER 2025 REGIONAL KEY FINDINGS
- ASIA: Index dropped to -0.30, from -0.06, indicating greater spare capacity across supply chains into and across Asia. This was mostly driven by a slowdown in Chinese manufacturers’ purchasing.
- NORTH AMERICA: Index fell to its lowest level since March (-0.45 in October, vs. -0.25 previously), signaling capacity at the region’s suppliers went underutilized to the greatest extent since prior to April’s sweeping tariff announcements.
- EUROPE: Index rises to three-month high of -0.25, from -0.53, indicating unused manufacturing capacity as the region’s recovery from its protracted industrial downturn remains sluggish.
- U.K.: Sharp drop in index to -0.80, from -0.57, highlighting sharp reduction in activity at the U.K.’s suppliers.
OCTOBER 2025 KEY FINDINGS
- DEMAND: September’s boost in factory purchasing – the strongest since June 2022 – was reversed in October as manufacturers in key economies such as China and the U.S. reported slowdowns in procurement. Factories’ orders of commodities, components and intermediate goods remain subdued, indicating a soft near-term outlook for producers.
- INVENTORIES: Reports from global procurement managers of an increase in stockpiling due to price or supply fears remain historically low, indicating limited concern about purchasing price inflation or shortages. The data continue to demonstrate a preference among manufacturers for lean warehouses.
- MATERIAL SHORTAGES: The global item shortages tracker remains well below its long-term trend level, signaling healthy supply levels for the world’s manufacturers. Factories will have little, if any, challenges in sourcing vendors for commodities, components and other intermediate products.
- LABOR SHORTAGES: There was a modest rise in labor-related capacity constraints during October, with reports of backlogs rising due to inadequate staff supply ticking up to a four-month high. Nevertheless, the labor shortages tracker was only marginally above its long-term trend.
- TRANSPORTATION: Global transportation costs ticked down slightly in October to just below historically average levels.
For more information, visit www.gep.com/volatility.
Note: Full historical data dating back to January 2005 is available for subscription. Please contact [email protected].
The next release of the GEP Global Supply Chain Volatility Index will be 8 a.m. ET, Dec. 10, 2025.
About the GEP Global Supply Chain Volatility Index
The GEP Global Supply Chain Volatility Index is produced by S&P Global and GEP. It is derived from S&P Global’s PMI® surveys, sent to companies in over 40 countries, totaling around 27,000 companies. The headline figure is a weighted sum of six sub-indices derived from PMI data, PMI Comments Trackers and PMI Commodity Price & Supply Indicators compiled by S&P Global.
- A value above 0 indicates that supply chain capacity is being stretched and supply chain volatility is increasing. The further above 0, the greater the extent to which capacity is being stretched.
- A value below 0 indicates that supply chain capacity is being underutilized, reducing supply chain volatility. The further below 0, the greater the extent to which capacity is being underutilized.
A Supply Chain Volatility Index is also published at a regional level for Europe, Asia, North America and the U.K. For more information about the methodology, click here.
About GEP
GEP® delivers AI-powered procurement and supply chain solutions that help global enterprises become more agile and resilient, operate more efficiently and effectively, gain competitive advantage, boost profitability and increase shareholder value. Fresh thinking, innovative products, unrivaled domain expertise, smart, passionate people — this is how GEP SOFTWARE™, GEP STRATEGY™ and GEP MANAGED SERVICES™ together deliver procurement and supply chain solutions of unprecedented scale, power and effectiveness. Our customers are the world’s best companies, including more than 1,000 Fortune 500 and Global 2000 industry leaders who rely on GEP to meet ambitious strategic, financial and operational goals. A leader in multiple Gartner Magic Quadrants, GEP’s cloud-native software and digital business platforms consistently win awards and recognition from industry analysts, research firms and media outlets, including Gartner, Forrester, IDC, ISG, and Spend Matters. GEP is also regularly ranked a top procurement and supply chain consulting and strategy firm, and a leading managed services provider by ALM, Everest Group, NelsonHall, IDC, ISG and HFS, among others. Headquartered in Clark, New Jersey, GEP has offices and operations centers across Europe, Asia, Africa and the Americas. To learn more, visit www.gep.com.
About S&P Global
S&P Global (NYSE: SPGI) S&P Global provides essential intelligence. We enable governments, businesses and individuals with the right data, expertise and connected technology so that they can make decisions with conviction. From helping our customers assess new investments to guiding them through ESG and energy transition across supply chains, we unlock new opportunities, solve challenges and accelerate progress for the world. We are widely sought after by many of the world’s leading organizations to provide credit ratings, benchmarks, analytics and workflow solutions in the global capital, commodity and automotive markets. With every one of our offerings, we help the world’s leading organizations plan for tomorrow, today.
Media Contacts
Derek Creevey
Director, Public Relations
GEP
Phone: +1 646-276-4579
Email: [email protected]
Joe Hayes
Principal Economist
S&P Global Market Intelligence
Phone: +44-1344-328-099
Email: [email protected]

Interpreting the data: Index > 0, supply chain capacity is being stretched. The further above 0, the more stretched supply chains are. Index < 0, supply chain capacity is being underutilized. The further below 0, the more underutilized supply chains are.

GEP Global Supply Chain Volatility Index
